Introduction
This tutorial will walk users through an example DegenGeom file, illustrating the various representations and relevant metadata for each level of degeneracy. For example, the thick surface representation includes each surface node along with surface normal directions for each panel. The panel representation will include the location of each thin-surface patch along with the local centroid, local camber, etc. The stick representation will include outlines of the primary feature lines of components (such as wing leading and trailing edges), local moments of inertia, thickness to chord ratios, etc. Points will contain information such as component mass, moments of inertia, wetted areas and volumes, and much more.
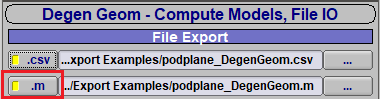
Along with OpenVSP, a series of MATLAB functions are provided to visualize different levels of model degeneracy. These functions are located in the “matlab” folder and are listed below. To use these functions, the *.m DegenGeom option flag must be selected when running the export. The MATLAB scripts will only accept this DegenGeom format.
– plotDegenSurf.m
– plotDegenPlate.m
– plotDegenStick.m
Example function call: plotDegenStick(‘myVSPmodel_DegenGeom.m’)
Note that the filename is passed to the function as a string.