The Curve Editor includes several options under the Display tab which control how both the curve and background are shown in the plotter. The color, line thickness, point size, and point color are adjustable and background images may be inserted, shifted, and scaled to fit. This makes recreating even highly complex cross-sections quite easy in OpenVSP. Also, under the Curve tab, there is an option to change the plot axes from the default normalized coordinates to absolute coordinates. This scales the axes by the set section height and width and may assist with visualizing the physical size of a custom cross-section.
Unique to the Curve Editor is the ability to zoom and pan the plot area with the middle and right mouse buttons, respectively. This enables users to very finely control each point manually, if desired, and quickly visualize the entire section as needed.
OpenVSP includes a manual curve editor that enables users to modify existing cross-sections or create entirely unique shapes with simple, click-and-drag operations. Any cross-section type may be converted to an Edit Curve by clicking the “Convert CEDIT” button next to the type dropdown and Show button. The Edit Curve type may also be selected from the dropdown to initialize a new Edit Curve at that cross-section. The curve editor is intended to make cross-section modification as user-friendly as reasonable while maintaining remarkable customization including multiple curve types (linear, spline, Bezier), three-dimensional control, symmetry, numerous display options, corner radii, and U-spacing distribution.
Users are encouraged to test this cross-section type to become familiar with the Edit Curve features but are warned that this is an advanced capability. If your model cross-sections can be implemented with other curve types such as ellipses, rounded rectangles, etc., then we recommend using those. Edit Curve sections should be used when the parameterization of existing cross-sections (including the number of control points or corners) is insufficient to accomplish your goals.
This tutorial will walk users through an example DegenGeom file, illustrating the various representations and relevant metadata for each level of degeneracy. For example, the thick surface representation includes each surface node along with surface normal directions for each panel. The panel representation will include the location of each thin-surface patch along with the local centroid, local camber, etc. The stick representation will include outlines of the primary feature lines of components (such as wing leading and trailing edges), local moments of inertia, thickness to chord ratios, etc. Points will contain information such as component mass, moments of inertia, wetted areas and volumes, and much more.
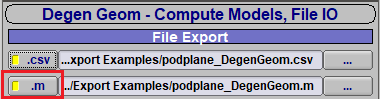
Along with OpenVSP, a series of MATLAB functions are provided to visualize different levels of model degeneracy. These functions are located in the “matlab” folder and are listed below. To use these functions, the *.m DegenGeom option flag must be selected when running the export. The MATLAB scripts will only accept this DegenGeom format.
An OpenVSP model may be subsequently reduced into geometrically simpler representations from thick surfaces to plates to sticks, and finally, to points all while maintaining metadata about the model. This process is called DegenGeom. Different model representations may be used for different purposes. For example, the plate representation is used to supply the VLM surfaces in VSPAERO, a stick representation may be used for a structural analysis, and the points representation may supply mass and inertia to a dynamics simulation. OpenVSP’s DegenGeom tool produces a file with each level of degeneracy and all relevant metadata for the model.
OpenVSP will export the airfoil distribution along a Wing component in either a DAT or BZ (Bezier) format. The number of airfoils written will correspond to the total spanwise Num U of your wing. When exporting airfoils, the window will ask to save an Airfoil Metadata file rather than the DAT or BZ. This metadata file provides the context and location of each airfoil file that is also written out in the process.